
In the next few write-ups, we’ll explore the often overlooked superpower of modern-day recommender systems: naive models.
The Simplest Learning Algorithm
In high school, you might have encountered intriguing probability puzzles, such as the Monty-Hall problem, which involved manipulating conditional probabilities. But at its core, Bayes’ formula is quite intuitive:
- Do you hold a belief about the world?
- As new evidence comes to light, what can you do?
So, put simply, the Bayes formula is:
Belief after evidence = (Belief before evidence) * (Evidence about the belief)
But the clincher is, that this formula is actually a loop! After the first update to your belief, your belief about the world can rapidly change every microsecond, as new evidence emerges.
while (belief keeps changing):
  belief(t+1) = belief(t) * incoming_evidence(t)
As an example: one could start with a very faulty belief about the world like say the earth is flat with absolute certainty. Yet if one assiduously updates their belief as new pieces of evidence emerges like satellite images, math proofs, geometrical arguments, one gets closer and closer to the truth.
Modern-day recommender systems use these belief update loops to create some of the fastest collaborative filtering algorithms. We’ll explore how this simple idea translates into these algorithms in the next post. But before that, let me introduce you to one of my delightful Bayesian pet-peeves.
A common mistake in excel sheets
Ratios are an easy way to compare the efficacy of a phenomenon. For example, the number of people who replied to an offer divided by the number of people who received the offer is a good way to test the efficacy of the offer’s campaign.
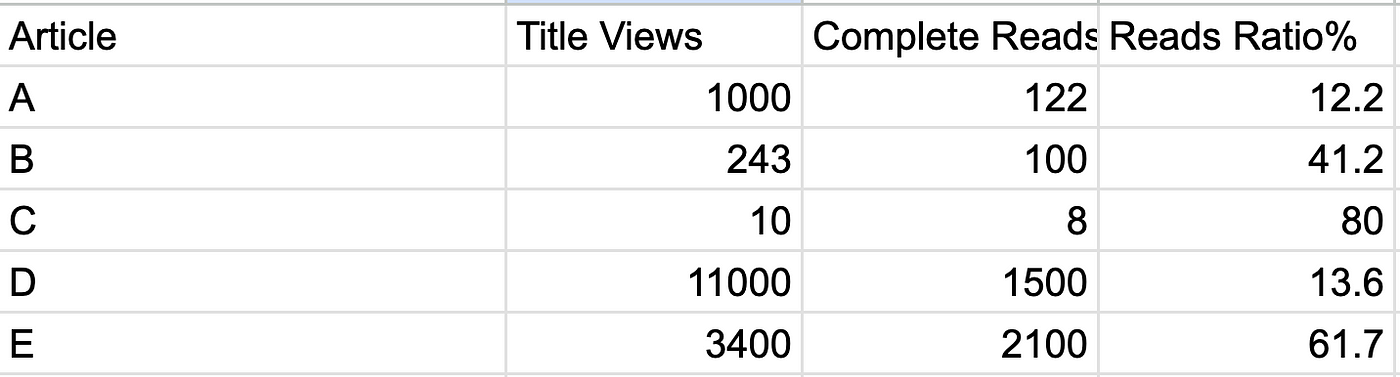
Now, let’s look at a sample Excel sheet. In the sheet below, we compute the reads ratio for each article as a percentage of the number of times it was read completely. Row C seems to show the highest engagement, almost close to 80%. So, is that the best story?
Although the reads ratio is the highest for C, it has also received the least number of views. This means we should have less confidence in our estimate because we’ve had less of an opportunity to update our belief.
A simple bayesian solution
What is the average (or p50) number of views received by all articles? Say 1000. What is the average (or p50) number of reads received by all articles? Say 200. These are your prior beliefs about the system. Now add these to your numerator and denominator and you get: 8+200/10+1000 ~= 20%, basically the system average telling you that you don’t really know much about this article’s efficacy.
Now let’s update the entire sheet. Now you can see that best article is E, which would match your general statistical intuition.

Why did I choose this example? To make a point: this common error is so prevalent that you’ll sometimes see it twice a day across newspapers, meeting rooms, discussions, and Twitter threads. Let’s remember the point of the Bayesian Loop: data/evidence is only useful if we’re updating a belief, not the other way around.
